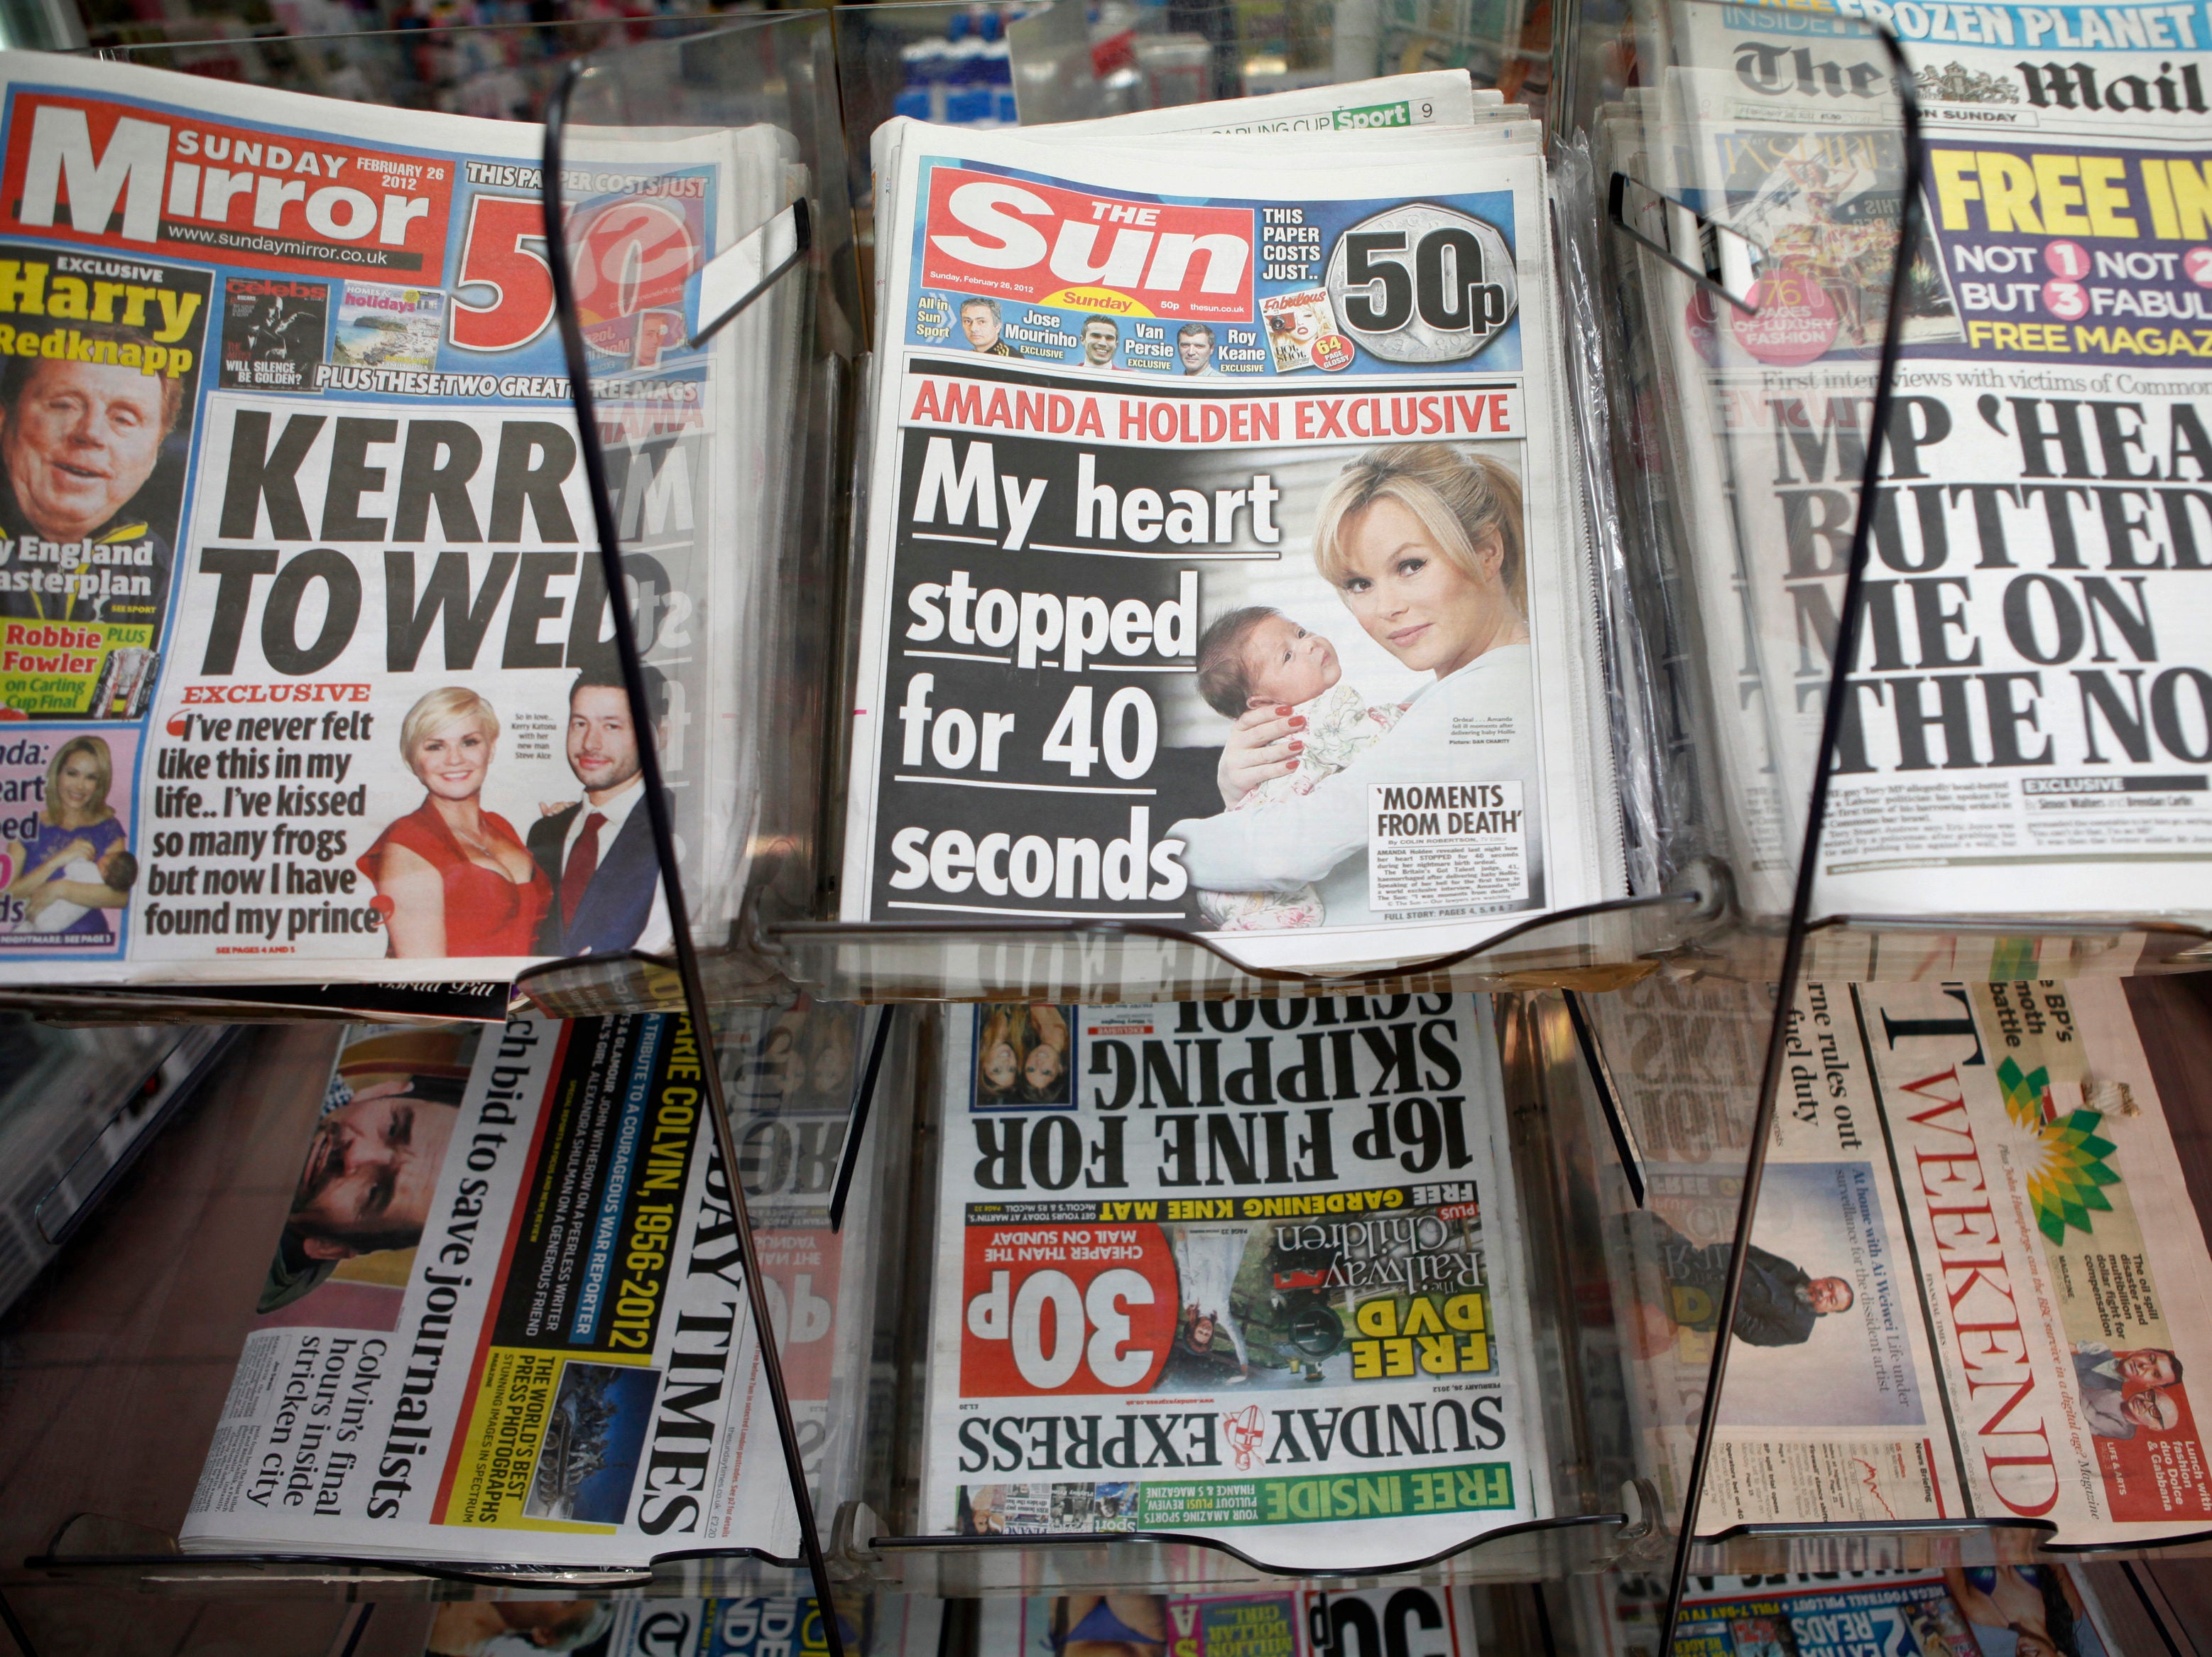
UK national newspaper sales have fallen by nearly two-thirds over the last two decades, according to analysis of ABC circulation data by Press Gazette.
The figure shows the extent of the devastation that digital disruption has wrought on the traditional print-centric newspaper business model.
In January 2000, 16 daily and Sunday paid-for national newspapers had a combined circulation of 21.2m, according to ABC figures.
Scroll down for full figures
Within ten years this had fallen to 16.4m among 17 newspapers – now including the Daily Star Sunday, which launched in 2002 – representing a drop of nearly a quarter (23 per cent).
But in January of this year, according to the latest circulation figures available, the same group of newspapers sold a total of 7.4m copies – a fall of more than half (55 per cent) within ten years.
The last decade has seen the rapid growth of mobile technology and social media platforms, both of which have changed the way readers access news with a move away from print and towards digital.
Circulation revenues from newsstand sales and print advertising revenues have shrunk as a result, with news publishers forced to diversify to survive.
The Daily Star has held up best against the decline following growth of 55 per cent between 2000 and 2010. Overall it has seen a circulation drop of 45 per cent over the past 20 years.
The Times comes in second at 49 per cent. It also did best to stem print circulation decline in the past decade, with a fall of just over a quarter (27 per cent). Sunday Times sales have fallen 44 per cent since 2010.
This could be a reflection of the Times website – where both titles publish – putting up a hard online paywall, although the FT, which was an early paywall adopter, saw its circulation fall 60 per cent in the past decade.
The worst performer is the Sunday People, which has lost 91 per cent of its circulation over the past 20 years, including 74 per cent in the last decade.
The figures include only titles that are still in continuous publication today.
Bucking the overall trend, the i paper, which launched in 2010, has grown its circulation from 133,472 in January 2011 to 217,182 in January this year (ABC). But it has fallen from a peak of 306,578 in May 2013.
The News of the World had a circulation of 4.1m in January 2000 and 3m ten years later, but closed following in 2011 with a circulation of 2.7m at the last audit by ABC in June of that year.
A number of newspapers stopped including bulk sales – those free copies found at airports, hotels and other venues that the publisher sells at a heavily reduced rate – in their circulation figures in 2018.
The Telegraph is no longer audited by ABC, so its 2020 figures shown below are actually from December 2019, the latest available.
The figures also do not include free newspapers the Metro, City AM and Evening Standard, whose distributions are not affected by market forces in the same way as paid-for titles.
| Publication | Total Circulation (ABC) | ||
| Jan 2000 | Jan 2010 | Jan 2020 | |
| The Sun | 3,557,336 | 3,006,565 | 1,250,634 |
| The Times | 726,349 | 508,250 | 368,929 |
| Sunday Times | 1,373,900 | 1,144,929 | 645,108 |
| Financial Times | 435,378 | 390,315 | 157,982 |
| Daily Telegraph | 1,039,749 | 691,128 | 317,817* (Dec 2019) |
| Sunday Telegraph | 822,931 | 527,742 | 248,288* (Dec 2019) |
| Daily Mail | 2,353,915 | 2,120,347 | 1,169,241 |
| Mail on Sunday | 2,323,720 | 2,048,008 | 967,043 |
| The Guardian | 401,560 | 302,285 | 132,341 |
| The Observer | 416,460 | 354,565 | 156,217 |
| Daily Mirror | 2,270,543 | 1,218,425 | 451,466 |
| Sunday Mirror | 2,008,961 | 1,124,620 | 367,244 |
| Daily Express | 1,050,846 | 674,640 | 296,079 |
| Sunday Express | 974,310 | 585,023 | 252,733 |
| Daily Star | 502,647 | 779,376 | 277,237 |
| Daily Star Sunday | 719,308* (Sept 2002) | 358,814 | 162,345 |
| Sunday People | 1,613,113 | 532,975 | 139,698 |
| TOTAL | 21,152,410 (exc. Daily Star Sunday) |
16,368,007 | 7,360,402 |
| Publication | ||
| % change in circulation from 2000 to 2020 | % change in circulation from 2010 to 2020 | |
| The Sun | -65% | -58% |
| The Times | -49% | -27% |
| Sunday Times | -53% | -44% |
| Financial Times | -64% | -60% |
| Daily Telegraph | -69% | -54% |
| Sunday Telegraph | -70% | -53% |
| Daily Mail | -50% | -45% |
| Mail on Sunday | -58% | -53% |
| The Guardian | -67% | -56% |
| The Observer | -62% | -56% |
| Daily Mirror | -80% | -63% |
| Sunday Mirror | -82% | -67% |
| Daily Express | -72% | -56% |
| Sunday Express | -74% | -57% |
| Daily Star | -45% | -64% |
| Daily Star Sunday | -77% | -55% |
| Sunday People | -91% | -74% |
| TOTAL | -65% | -55% |
Picture: Reuters/Andrew Winning
Email pged@pressgazette.co.uk to point out mistakes, provide story tips or send in a letter for publication on our "Letters Page" blog
